Jones Act Externalities To US Offshore Wind Development
1 | Introduction
Developments within the U.S. offshore wind industry are rapidly accelerating due to environmental, economic, and social tailwinds. Climate change is a pressing environmental challenge that requires a departure from conventional carbon-based energy generation. Moreover, European construction of offshore wind has recently spurred economic forces of cost reduction and technological development. Both of these forces facilitate price competitive, utility-scale, offshore wind generation, rendering it competitive amongst other energy generation sources. And, because of the aforementioned environmental and economic rationales surrounding offshore wind, state governments are eager to harness the first mover advantages that the establishment of supply chain and job creation bestows on their constituents.
Offshore wind, as suggested by its name, is composed of wind turbines that have been constructed offshore and in water. To ensure that offshore wind farms (OWF) are economically competitive, they are increasingly developed miles off the coast where wind levels are consistent and of substantial magnitude, and Nimbyist opposition is low. In the U.S., these waters belong to the legislative jurisdiction of the Federal Government. This imposes the most significant challenge of implementing U.S. offshore wind, particularly due to the Merchant Marine Act of 1920. The Merchant Marine Act of 1920, also known as the Jones Act (JA), is a federal maritime cabotage law established in 1920 by Senator Wesley Jones of Washington. The intent of the legislation was to foster an adequate American merchant marine to compete with international shipping.1 It stipulates that goods and persons which are transported between U.S. ports, be transported on vessels that are built, owned, and operated by U.S. citizens or permanent residents. As the offshore oil industry has established, the JA also considers any facility connected to the sea floor, such as a monopile or jacket foundation, to be classified as a U.S. port. This creates a significant logistical and economic challenge for the U.S. offshore wind industry, specifically in its accelerating stages.
Offshore wind’s establishment within Federal waters mandate its compliance with the JA. This requirement may jeopardize cost effective sea vessel-based installation approaches. Developers, state and federal governments, shipyards, vessel operators, and other affected stakeholders will need to plan their operations accordingly to ensure that a sufficient quantity of vessel support is legally and technically available to complete their projects. This paper intends to analyze the current state of JA compliant vessels in relation to the offshore wind industry, some of the economic benefits (and disbenefits) that accompany the legislation, and its implications upon the foreseeable future of the U.S. offshore wind industry.
2 | Competitive Cost of energy in the United States
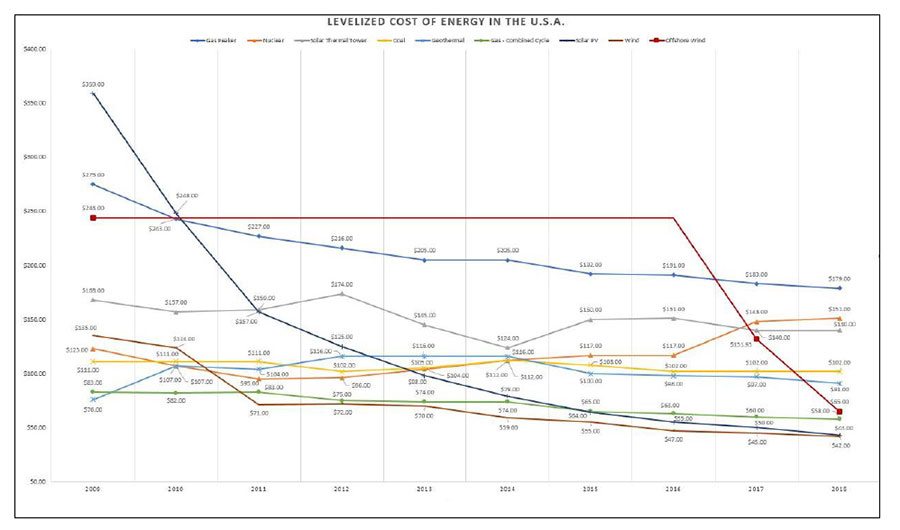
Energy markets in the U.S. are composed of two major segments; the production (or generation) of energy, and the transmission and distribution of electricity to consumers. The latter is a natural monopoly, as the duplication of energy delivery networks often produces an inefficient economic utilization of resources. However, the production of energy is a competitive market relying on market forces which lead to lower consumer costs. Energy, regardless of its source, is a commodity. Therefore, nascent technologies like offshore wind must compete with oil, natural gas, alternative renewables, and other energy sources present in the market. Government subsidies can provide aid to galvanize developing industries. This may ultimately benefit society through the development of the labor market, the reduction of energy costs, and the absence of negative externalities such as carbon emissions. Additionally, government subsidies remove certain barriers of entry to the market, and allow for competition to exist, ideally driving prices down. Energy prices are often compared by a common metric called the levelized cost of electricity (LCOE), which is the net present value of the unit-cost of electricity over the lifetime of a generating source. Figure 1 shows the dramatic decrease of the LCOE of renewable energy in the U.S., specifically regarding solar and wind generation.2 Although offshore wind is still young in the U.S., it has already been forecasted to be a competitive energy source. In fact, the developer Vineyard Wind’s Power purchase agreement (PPA) with the state of Massachusetts is forecasted to reduce consumers’ monthly bills by approximately 0.1% to 1.5% on average.3
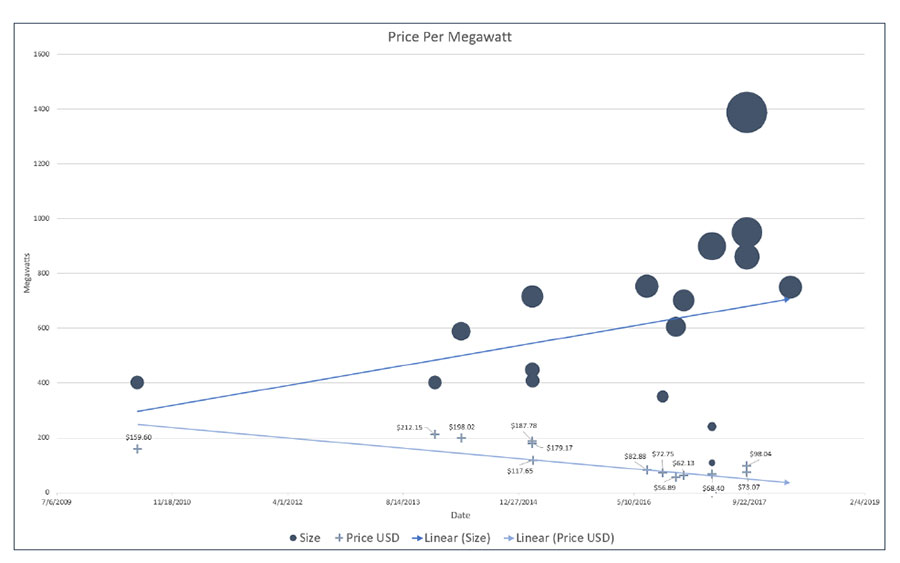
So how exactly does the JA affect the levelized cost of offshore wind energy? Economic competitiveness of an offshore wind farm (OWF) is correlated with its size. This is, in large part, due to the substantial portion of a project’s overall cost belonging to the installation of the turbines at the onset of its development (~30%).4 As an economy of scale, the increased magnitude of an OWF’s generation capacity leads to substantial savings in the cost of its final product. This is demonstrated by analyzing three distinct LCOEs from Block Island Wind Farm, Maryland’s signed PPA for offshore wind, and the aforementioned Vineyard Wind. 5 Block Island Wind Farm is the first U.S. OWF and has a 30 MW nameplate capacity. It is located outside of Rhode Island and Massachusetts and secured a PPA for $244 MWh in 2009.6 In 2017, the Maryland Public Service Commission approved a LCOE of $131.93 MWh for two projects that collectively have 368 MW in nameplate capacity.7 And, only one year later, Massachusetts’ Vineyard Wind project struck a $65 MWh LCOE with 800 MW of nameplate capacity. This is not an American phenomenon, as can be seen in Figure 2, which demonstrates an inverse effect on price as the overall production volume of offshore wind has increased in the European market.8 The cost decrease from the economy of scale is supported by a technological learning curve effect. The underlying economic intuition of this effect is that consistent improvements in production cost occur because of increased knowledge and experience. Therefore, experience leads to efficiency gains in the installation of wind turbines, which leads to a reduction in their installation costs, and levelized over the life of the OWF. This decrease in cost is an endogenous outcome of industry growth and is necessary for offshore wind’s economic viability in the U.S. energy market. As OWFs increase in capacity, their LCOE decreases. However, the number of vessels needed for their installation increases with capacity and these vessels must be JA-compliant. Therefore, vessels represent a non-decreasing factor on an otherwise diminishing marginal cost of capacity.
3 | Significance of Vessels on project cost
The construction of offshore wind is naturally dependent upon the maritime industry, as utility-scale generation is only feasible far from shore. Lessons learned from the European offshore wind market, and specifically the UK, have led to the study of optimizing vessel allocation in the installation phase of an OWF. When choosing an offshore wind turbine installation vessel (WTIV), a developer attempts to achieve cost minimization of the installation, and the maximization of the rate at which offshore wind turbine generators (WTG) begin generating energy and producing revenue.9 Installation cost is a function of the time required to install the WTGs and the coupled vessel day-rates. As previously mentioned, installation costs comprise approximately 30% of the overall project cost of an OWF. Vessels account for 20% of the installation cost, second only to the costs of cables, turbines, and foundations which account for 60% of installation costs.10 Therefore, vessel installation fees alone account for approximately 6% of the overall cost of the project. This is a significant sum when considering the magnitude of an OWF’s overall project cost.
The first strategic theme of the U.S. Department of Energy’s (DOE) “National Offshore Wind Strategy” (2016) advocates for the reduction of costs and technology risks, specifically related to installation, O&M, and supply chain solutions.11 Due to the significance that vessels contribute to an OWF’s installation, their costs will strongly influence the competitive viability of individual projects and the industry at large. For example, Vineyard Wind’s 800MW OWF anticipates a maximum of 46 vessels simultaneously on-site for installation, with an average of 24 vessels performing installation operations daily.12 Vessels, and their associated day rates and respective efficiencies, may therefore affect a significant degree of variability on the installation costs of an OWF.
4 | Fleet Analysis
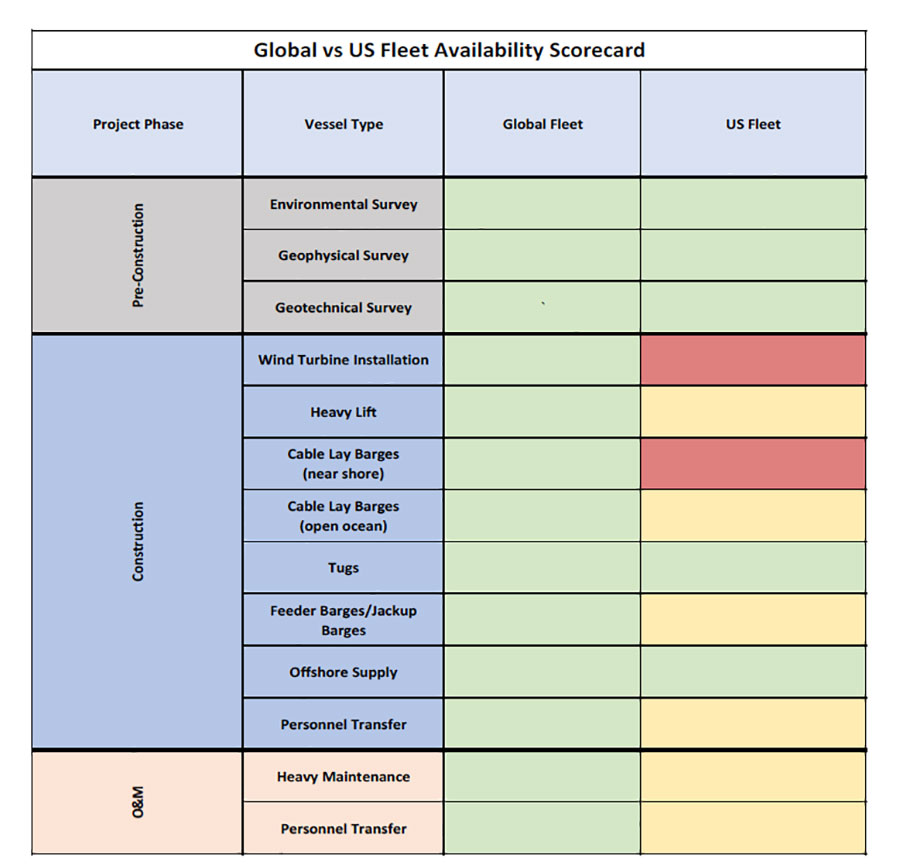
A variety of vessels are required through every phase of an OSW project. The United States’ robust offshore oil and gas industry has supported the manufacturing and operation of many JA compliant vessels that could be repurposed for OSW development. These existing vessels can be used for pre-construction, construction, and post-construction O&M and include tugs, survey vessels, crew transfer and supply vessels, barges, and open ocean cable laying vessels (Table 1).
The vessel type that does not exist in the current JA compliant fleet, and represents the largest choke point in OSW development, is the specialized wind turbine installation vessel (WTIV). These self-elevating vessels can both transport and install multiple foundations or turbines and do not require the use of feeder barges. In addition to the efficiency gains from using a single vessel for construction/decommissioning, a WTIV’s heavy-lift, high-height crane allows for the installation of more cost competitive, higher capacity turbines. While there are JA floating heavy cranes and floating sheerleg cranes capable of performing similar lifting tasks to WTIVs, due to weather conditions off the Atlantic coast, these vessels are not able to safely operate throughout a significant portion of the year.
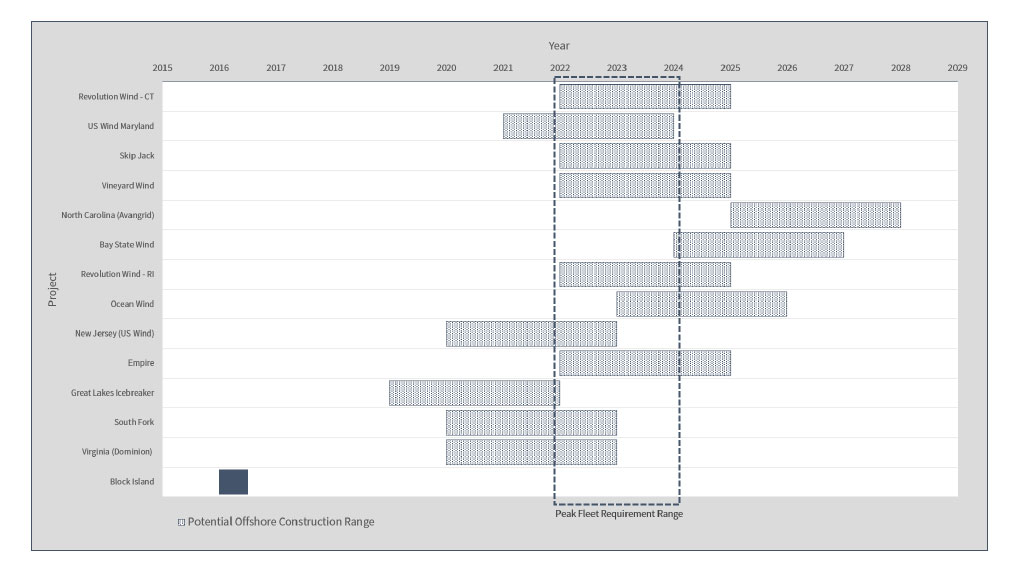
Northeastern and Mid-Atlantic states’ increasingly ambitious targets for offshore wind development have added additional pressure to JA vessel supply. With several of the proposed OSW projects likely having significant overlap in their construction timelines, sufficient access to JA compliant support and installation vessels will become a major bottleneck. We project peak-fleet needs to occur between 2022 and 2024, with a maximum-need-scenario of twelve concurrent OSW projects requiring WTIVs.13 Even with the recent commissioning of two JA WTIVs, the existing international fleet of installation vessels is unlikely to meet both U.S. and international market demands.14
Compounding the vessel availability issue is the high likelihood that any OSW development in construction phase beyond 2021 will be looking to install turbines of at least 10 MW, with some developers having committed to using the 12 MW General Electric Halliade X. Turbines being installed today are averaging approximately 50 tons per megawatt, resulting in a 12 MW turbine that would be a minimum of 600 tons. Currently, the only JA-WTIVs capable of these requirements are in the process of being built, and wind turbines in the 10 MW or greater range will push the limits of existing non-JA-compliant WTIVs, further limiting the number of vessels available to meet OSW development through the mid-2020s.
5 | Solutions: Adapt and Overcome
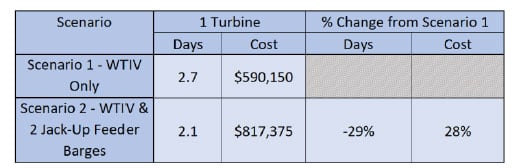
GustoMSC, a design and engineering firm of offshore vessels, released a report in 2017 for Northeast state-led energy agencies that delineated two feasible construction strategies for the installation of WTGs based on commercially available types of vessels. The first strategy involves using a JA-compliant WTIV to transport WTG components from the staging area of a port to the OWF site to ultimately perform the installation. This is a standard practice in foreign offshore wind projects and minimizes logistical complexity because it uses a single vessel for installation. The second strategy involves using a non-JA-compliant stationary WTIV and two JA-compliant feeder barges to transport WTG components from a staging area to the OWF site, where the stationary WTIV uses its crane to transfer and install the WTG. The current lack of JA-compliant WTIVs will force the accelerating U.S. offshore wind industry to employ the second strategy.
The second strategy, while approximately 28% more costly in vessel day rates relative to the first strategy, offers an approximate 29% decrease in time of installation, as shown in Table 2.15 The decreased time of installation allows energy generation to occur sooner. Therefore, the cost differential is potentially minor between the two installation approaches. Despite the delay risks imposed by inclement weather and high day rates, the second strategy will be necessarily employed for initial U.S. OWF construction, and for the foreseeable future.
6 | Help is not on the way
Initial U.S. OWF installation will have to accept and utilize the feeder barge strategy in order to complete their projects as currently scheduled. However, OWF developers will have the ability to choose between the feeder barge solution and JA-compliant WTIVs. The first JA-compliant WTIVs is expected to be operational by the end of 2019, according to a statement by the managing director of Renewables Resources International.16 The new WTIV will be a converted JA-compliant vessel capable of installing 12 MW turbines. The only other JA-compliant WTIV currently being commissioned will be ready sometime near the end of 2021 and beginning of 2022 at the earliest, according to Aeolus Energy Group.17 These vessels will provide a substantial logistical aid to the U.S. offshore wind pipeline. With projected WTIV build times of approximately three years, a need to ensure vessel rates of return, and a large sunk cost, it is likely these two vessels will compose the entirety of JA-compliant WTIVs for some time.
7 | Everyone loses when no one competes
Bottlenecks and delays in construction as a byproduct of vessel scarcity is not a new hurdle, as discussed by Paterson et al.18 The United Kingdom, a global leader in offshore wind, experienced bottlenecks and delays due to a lack of availability of specialized vessels caused by competitive forces of the oil and gas sector. Ill-equipped vessels were sourced at inflated rates due to a lack of vessel competition.
Currently, U.S. natural gas prices remain lower than oil prices which has slowed the use of purpose-built vessels in the Gulf. While oil and gas vessels can satisfy many OSW demands, the availability of oil and gas industry vessels for use in OSW development is dependent upon the fluctuating demand for offshore fossil fuels. An increase in the price of oil will create a stronger demand for offshore oil and gas, thus restricting the availability of competitively priced OSW support vessels. The current market structure is imperfectly competitive among vessel owners and operators and constrains the supply which increases rents. This artificially increases the overall cost of an OWF and its subsequent LCOE. This presents two critical concerns on the offshore wind LCOE: 1) increased LCOE which weakens offshore wind’s competitiveness with other energy sources, and 2) passes higher prices to the consumer, which in this case is the public at large.
8 | Large pipeline requires feeder solution/foreign WTIVs and JA WTIVs
The future of U.S. offshore wind certainly lacks no ambition. Almost every state on the Atlantic Seaboard is planning pipelines of utility-scale OWFs to be achieved over the next decade. The Northeastern states are especially ambitious in their planned offshore wind goals. In 2016, Massachusetts announced that it intended to develop 1,600 MW of offshore wind by 2027.19 With Vineyard Wind’s unexpectedly low LCOE for its 800 MW development, the Commonwealth announced in 2019 that it is considering doubling this goal and procuring an additional 1,600 MW of offshore wind for a total of 3,200 MW.20 In 2018, New Jersey Governor Philip Murphy took an even bolder step with his order to development 3,500 MW of offshore wind by 2030.21 Not to be outdone, New York announced later in 2018 that it intended to procure 2,400 MW of offshore wind by 2030.22 Governor Andrew Cuomo of New York announced in his January 2019 State of the State report that he intends to push for 9,000 MW of offshore wind by 2035. These three states alone have 7,500 MW of established offshore wind capacity by 2030, with a possible 15,700 MW by 2035. These numbers don’t include South Carolina, North Carolina, Maryland, and Delaware, which all have offshore wind developments of their own being planned. More specialized vessels are needed to deliver these projects. The public demand exists, the vessels don’t.
9 | Conclusion
The offshore wind industry in the United States faces two main challenges, both of which are exasperated by the continued enforcement of the Jones Act. The primary hurdle is the availability of vessels capable of installing wind turbines of 10 MW or greater. The United States’ shipbuilding infrastructure will be unable to produce enough WTIVs in time to meet projected demands. Even with a blended approach of feeder barges and newly minted JA-compliant WTIVs, the global fleet does not have enough WTIVs available to support 12 concurrent OSW projects.
Secondly, while the cost competitiveness of OSW has seen a marked improvement over the past decade, the Jones Act ensures that OSW pricing will remain coupled to the offshore oil and gas industry, at least until enough JA compliant WTIVs are produced. These additional costs will be passed on to developers and ultimately the rate-paying public. The Jones Act’s bottlenecking of available vessels will guarantee vessel day rates remain artificially high, impede the OSW industry’s growth, and adversely impact supply chain and workforce development.
The United States OSW industry is not developing in isolation; there are dozens of additional OSW projects throughout the world which will require WTIVs capable of installing +10MW turbines. In order to meet these demands, foreign flagged, large capacity, WTIVs will continue to be commissioned. An accelerating, global need for WTIVs bodes well for the U.S. shipbuilding industry; JA WTIVs will be able to find plenty of work outside of the U.S. were domestic development to slow down. However, potential future demands do not solve the imminent need for WTIVs in the United States. To ensure State targets remain achievable, waiving the Jones Act for WTIVs would be the best solution. Such a waiver would not adversely impact the U.S. shipbuilding industry; domestic OSW projects will proceed with or without JA compliant WTIVs. While not a panacea, a waiver would allow the U.S. market to maintain momentum in OSW development.
This same momentum could also prove to be a hinderance to the long-term growth of U.S. OSW. States will need to coordinate at a high level to minimize project construction overlaps and so avoid bottlenecking available WTIVs. Such coordination would also mitigate the development of redundant pieces of onshore infrastructure needed to support offshore projects, principal among these being port facilities. Lastly, interstate coordination could see the establishment of state-backed subsidies for the commissioning of JA WTIVs, further mitigating the impact of the Jones Act to OSW development.
Failing to receive a Jones Act waiver does not represent an insurmountable challenge. Feeder barges supplying foreign flagged WTIVs is a viable construction method. However, such efforts will only mitigate the vessel chokepoint. The issue of consumer cost reduction will remain. The Jones Act will still impose a major negative externality on what would otherwise be a competitive market. The levelized cost of OSW energy, which has been on pace to reach market parity with terrestrial wind and solar photovoltaics, will remain affectedly higher than other renewables.
References
Angela M. O'Connor, Robert E. Hayden, Cecile M. Fraser. 2018. "D.P.U. 18-76." October 31.
Business Network for Offshore Wind. n.d. Business Network for Offshore WInd. Accessed December 20, 2018. https://www.offshorewindus.org/about-offshore-wind/usmarketoverview/.
Clarendon Hill Consulting. 2018. Revised Navigational Risk Assessment for Vineyard Wind. Risk Assessment , Somerville: Clarendon Hill Consulting.
COWI. 2018. Inshore Feeder Barge Conceptual Feasibility Study for Offshore Wind Farms. Summary Report, Albany: New York State Energy Research and Development Authority.
Douglas-Westwood. 2013. Assessment of Vesel Requirements for the U.S. Offshore Wind Sector. Grant Opportunity, Washington, D.C.: United States Department of Energy.
E. Barlow, D. Tezcaner Ozturk, S. Day, et. al. 2014. "An Assessment of Vessel Characteristics for the Installation of Offshore Wind Farms." International Conference on Marine Technology 1-7.
GustoMSC. 2017. U.S. Jones Act Compliant Offshore Wind Turbine Installation Vessel Study. Houston: GustoMSC.
Jack Paterson, Cr. F. D'Amico, Dr. P.R. Thies, Dr. E. Kurt, Prof. G. Harrison. 2017. "Offshore Wind Installation Vessels A comparative assessment for UK offshore rounds 1 and 2." Ocean Engineering 1-17.
Jones, Wesley L. 1921. "The Merchant Marine Act of 1920." Academy of Political Science 89-98.
Kuser, Michael. 2019. "Mass. Looks to Double Down on OSW, Clean Goals." RTO Insider, January 13.
Lazard. 2018. Lazard's Levelized Cost of Energy Analysis - Version 12.0. Lazard .
Maryland Public Service Commission. 2017. "Maryland PSC Awards ORECS to Two Offshore Wind Developers." maryland.gov. Baltimore, May 11. Accessed December 12, 2018.
Moody's. 2018. "Offshore wind is ready for prime time." Infrastructure and Project Finance. Moody's, 29 March.
New York State Energy Research and Development Authority. 2019. New York State Offshore Wind. January. Accessed January 24, 2019. https://www.nyserda.ny.gov/All%20Programs/Programs/Offshore%20Wind.
Philip Murphy. 2018. "Executive Order No. 8." nj.gov. January 31. Accessed January 24, 2019. https://nj.gov/infobank/eo/056murphy/pdf/EO-8.pdf.
Pitman, William. 2016. "Governor Baker Signs Comprehensive Energy Diversity Legislation." mass.gov. August 8. Accessed January 24, 2019. https://www.mass.gov/news/governor-baker-signs-comprehensive-energy-diversity-legislation.
Robert H. Hoaglund II, Ben Dobbs. 2018. "Vineyard Wind Power Purchase Agreement." Boston, August 1.
Roberto Arantegui, J.M. Yusta, Jose Antonio Bominguez. 2018. "Offshore wind installation: Analysing the evidence behind improvements in installation time." Renewable and Sustainable Energy Reviews, September: 92.
Rochas, Anna Flavia. 2018. newenergyupdate.com. May 9. Accessed January 18, 2019. http://newenergyupdate.com/wind-energy-update/flurry-us-offshore-vessel-deals-prepares-market-huge-turbines.
Siljan, Kristine Hansen and Oda Marie. 2017. "Optimizing the Vessel Fleet Used to Install an Offshore Wind Farm." Industrial Economics and Technology Management.
U.S. Department of Energy and U.S. Department of the Interior. 2016. National Offshore Wind Strategy. Washington, D.C.: DOE/GO.